Thank you for submitting your request.
We will get back to you shortly.
This website uses cookies.
Cookies are small text files that allow us to create the best browsing experience for you on our site. By continuing to use this website or clicking "Accept & Close", you are agreeing to our use of cookies. To understand how we use cookies or how to manage them, please see our cookies policy.
This website uses cookies.
Currently, cookies are disabled in your browser. Please enable them to continue.
Cookies are small text files that allow us to create the best browsing experience for you on our site. To understand how we use cookies or how to manage them, please see our cookies policy.

Share your requirements and we'll get back to you with how we can help.
Headquartered in Germany, our client is the research and development center for the world’s largest manufacturer of premium and commercial vehicles. The center focuses on research, IT engineering, and product development.
Automobile
A centralized log management solution enables enterprises to access service metrics and log files to capture and analyze business data. We migrated the client’s documentation monitoring system into the ELK stack to generate real-time visualizations, delivering a convenient end-user experience with a Kibana-based dashboard. The solution helped the client gain actionable insights to achieve operational excellence.
The client wanted to upgrade the IT infrastructure and help engineers overcome the challenge of running multiple scripts to access the vehicle documentation logging system.
We migrated the client’s vehicle documentation monitoring system into:
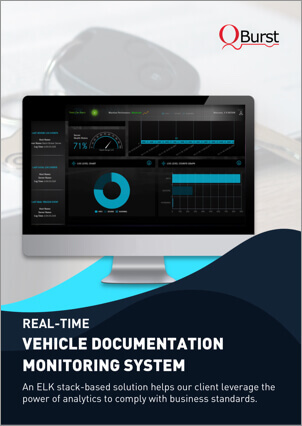
The vehicle documentation monitoring system consists of multiple servers that handle daily transactions. Kibana visualizations were generated to monitor system servers, which include transaction and metric monitoring.
The solution monitors application transactions, calculates response time, and plots graphs for load time/request response time. Additionally, it monitors DB logs, DB transactions, and DB health.
The solution drills down transaction details, processes load details, and presents them in the form of intuitive visualizations using Kibana.
The client wanted to architect, configure, and support their ETL process to develop telecom mediation layer data and generate invoices. This included dealing with large volumes of data across multiple source systems, transforming and loading data to and from data marts and data warehouses.
We migrated the client’s vehicle documentation monitoring system into:
The vehicle documentation monitoring system consists of multiple servers that handle daily transactions. Kibana visualizations were generated to monitor system servers, which include transaction and metric monitoring.
The solution monitors application transactions, calculates response time, and plots graphs for load time/request response time. Additionally, it monitors DB logs, DB transactions, and DB health.
The solution drills down transaction details, processes load details, and presents them in the form of intuitive visualizations using Kibana.